
Profiler output
First, let's reiterate that the form of the output is not fixed and you can change it. Thus, this chapter is not intended to be a user manual for the _profiler microapplication, but primarily a list of the information that the profiler operates on, as well as an explanation of the meaning of that information. So hooray for that.
Running Time
A very basic information and indication of whether everything is OK with the application. Needless to say, it should take a minimum of time to execute the request. This has an impact on the user's feeling of the application, but also on the server load (and thus the notional survival of the application under load) and for example, Google doesn't like slow sites much either.
This information is therefore the first thing you see in the status bar.
Attention! This timestamp only includes the interval between the start of the Profiler and the end.
It does not include (and by definition cannot include):
- Any latency on the network connection, the webserver itself, etc.
- PHP overhead for parsing and executing scripts
- It does not include anything within the application that was executed before the profiler was activated. Therefore, the Profiler is initialized as soon as possible. Only basic setup is done before it, and this should take a minimum of time.
Memory consumption
It's actually the same as the runtime. So see the previous text.
Cache Status
This is very important! The indication of whether or not a cache is enabled (Autoloader and MVC) is crucial. In practice, I do this by debugging the application both with the cache turned off (first) so that its performance is sufficient even without the cache, and after that with the cache turned on - that is, in the form and state it will run in on a production environment in practice and operation.
Why is this important and why test in both modes?
- The application must be decently fast even without the cache. What's the use that with cache the request is processed in 0.1s, when with cold cache maybe hundreds of SQL queries are generated and even on your unloaded localhost the request is executed in maybe 1.2s (a bit extreme case, but it can happen). This is an unacceptable state of affairs and means problems for the application in the future.
- The application must work well and correctly with the cache. It may happen that with the cache enabled something starts behaving a bit differently than without the cache. This is one reason. And the other reason is that the cache may not work as you expect and the app will not perform as you expected when you turn it on.
Then you need to test and verify everything. That's why the cache status is one of the key pieces of information.
Number of SQL queries
I would argue that in our industry, SQL is a great servant, but a very cruel master. Most of the performance problems with online applications that I have encountered in my practice were caused by working with relational database - SQL. Classic problems:
- Large number of SQL queries ...
- Unoptimized queries, unindexed tables
- An overall unclear concept of working with relational database ... (e.g. unnecessary repeated query calls, etc.).
Unfortunately, it can be said that many developers (fortunately not all) work with databases and it does not occur to them to consider that every such query is sent to the server via TCP/IP using its protocol, parsed there, then processed/executed and the server "hunts" data from tables, reads it from disk, puts it in memory (God forbid, again on disk) and then sends it back the same way. This is actually an insane amount of work and resources used (memory, CPU, network connection, total time)
This is why I've learned that the less SQL the less problems. No, I don't consider relational databases to be a bad thing. On the contrary. It's great! But it has to be done judiciously. It's like everything in this world :-) A relational database is simply not meant to be the center and main "heart and brain" of an online application. I know many may disagree with me. I also thought otherwise a long time ago. But practice has simply led me to this realization and conviction.
And that's why the number of SQL queries is one of the basic indicators (of course, it also depends on what the queries are - quality is as important as quantity). But you can say that the effort is to send the user an output ideally with a SQL query count of 0 (if possible - especially when using different caches and pre-generated outputs)
Status of CSS and JS bundlers
Indicates whether Jet is making the requested CSS and JS files bundled (bundled into a single file). This does not affect the processing of a particular application request, but it does affect the overall loading speed of the application in the user's browser. So good to know :-)
Run Blocks
In the run detail information, the application is divided into blocks. These blocks are nested within each other - it is a tree structure, where the parent block is a summary of the run information of all its children. This allows you to search in detail for where the problem is.
In practice, it looks like this:
You can (and should) define the blocks yourself.
But if you're using the full MVC subsystem, Jet will pretty much do it for you, but of course the ability to create additional blocks manually is retained.
Of course, if you're developing an application without Jet MVC, it's up to you and your discretion whether and how you create the blocks.
Running Block Information
Running Time
We have already described this in the context of the overall information Profiler displays. The only difference is that here it is in the context of the start and end of the run block.
Memory Consumption
The block context shows how much the memory consumption has changed within the block. The goal is to identify where the largest increase in memory consumption occurred.
Messages
To make debugging easier and clearer, you can add various debugging information to the block. Sometimes Jet already does this for you and adds some useful information itself, but mainly it's in your control.
Note that in addition to the message, you can also see the location from which the message was sent.
Executed SQL queries
In addition to the general overview of all executed SQL queries (see below) you can see just those queries that were executed in the given block. The information is the same as in the general overview of queries (see below), but it is related to a specific block.
Information about the beginning and end of the block
For better clarity, information is given where the block starts and where it ends (in which script, on which line). This information includes the backtrace.
Anonymous blocks
If you see a "?" instead of the block name, then it is an anonymous block. What is it? Suppose that at a given level one block is finished but another has not yet started, the system knows that it is currently in a notional vacuum like this and initializes an anonymous block and collects information into it.
An anonymous block is exactly the same as the named block defined by you (or Jet), only the name is unknown and it is created and closed completely automatically . Once the start of the named block is marked, the anonymous block automatically ends.
SQL queries - general overview
I have already written about the importance of monitoring the situation around SQL queries. Now let's see what Profiler can do for this issue. Let's look at an example output first:
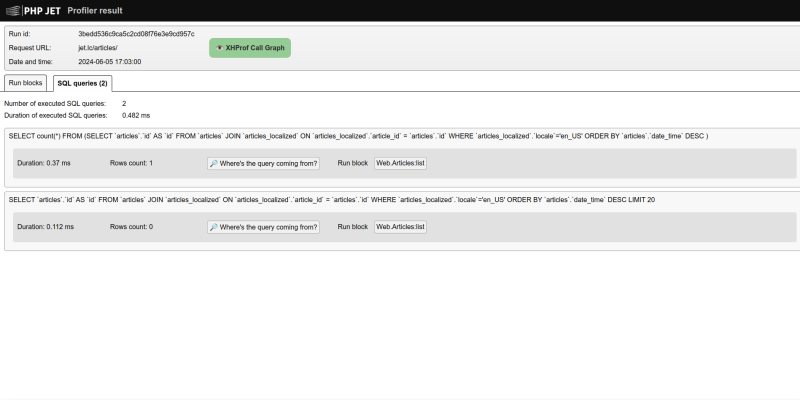
- The very first piece of information is what block the query was executed in. Just as you have a list of executed queries for a given block (exactly the same information as this), the overall query list refers to the blocks.
- The SQL query itself follows.
- The information about how long it took to execute the query should not be missing.
- The number of rows of the SELET result (or affected rows - e.g. UPDATE) is such an important piece of information that it can be a strong warning against working with too much data.
- And the backtrace of where the query was executed must not be missing.
At the very end, the overall summary must not be missing: how many queries were executed and how long it took to execute them in total.
I wish you to always have the numbers and runtime information as favorable as possible ;-)